 SYNCHRONOUSMANAGEMENT
 SYNCHRONOUSMANAGEMENT
51 Seaside Ave.
Milford, CT 06460
Phone: 203-877-1287
Fax: 203-878-2939
![]()
MAKE-TO-ORDER KANBAN
INTRODUCTION
Most managers of non-repetitive shops look with envy on the ease of scheduling the repetitive shop with Kanbans. The benefits of Kanban pull systems in the repetitive shop have been significant and well-documented. Unfortunately, these same benefits have been elusive for the job shop, where departments are functionally organized, where work orders are required, or where many jobs are one-time production. Until now, that is.
SYNCHRONOUS MANAGEMENT has developed and implemented an approach we call MTO KANBAN, which "pulls" orders through the job shop based on the demonstrated ability of the shop to produce. The following describes the development of MTO KANBAN for a product and process Development Operation.
In 1988, Development Operations (DO), an engineering prototype shop. employed about 300 direct labor personnel on each of two shifts, operating about 183 functionally organized machining, fabricating and metal treating work centers. The DO shop completes approximately 10,000 work orders per year (200 per week), usually in quantities of one each, with up to 350 operations on a routing. Forecasting is non-existent, and priorities are set via an infinite-reverse scheduling system. Priorities are communicated via operation due dates and critical ratios, plus a management "priority code" override.
At the beginning of the engagement, about 2300 work orders (11 weeks' worth, and increasing) were in work-in-process (WIP), with another 1800 orders (9 weeks' worth) awaiting release. The 2300 orders in WIP represented over seven times the number of jobs which could be worked on at any point in time (2300 orders/300 operators). The average work/wait ratio (actual hands-on time vs. total cycle time through the shop) was about 8%, and declining. On about 900 (40%) of the orders in the shop, the operation due dates and critical ratios were being overridden by the management priority code. In addition, shop management was spending up to three hours per day in expedite and shortage meetings.
The goals were to reduce the shop lead time to six weeks and to improve the work/wait ratio to 15%. The challenge was to provide a mechanism for reducing the multiple of orders to operators to a minimum, while still fully utilizing DO's critical resources. The results would be a corresponding reduction in shop lead times, and an increase in the work/wait ratio. With fewer orders in WIP, orders could be matched more closely to actual needs, improving the effectiveness of the existing shop load and priority scheduling systems.
The approach decided upon was a "pull" system which would throttle the release of work to the shop based on the actual completion of work. Since the non-repetitive nature of the shop precluded using a standard Kanban approach based on the repetitive consumption of inventory, we focused instead on the repetitive consumption of critical capacity.
IDENTIFYING CRITICAL RESOURCES
The first step in developing the system was to identify the critical resources, or "control valves", to improved flow in the shop. These were identified through a combination of:
Rough-cut capacity analysis. Figure 1 shows the load to capacity ratios of key work centers over the scheduling horizon. Note the loads in weeks worth of work due in the next four weeks and the next twelve weeks. These indicate both temporary and shifting bottlenecks.
| AREA | MAN POWER | % OF TOTAL MANPOWER | TOTAL LOAD (WEEKS) | 4-WEEK LOAD (WEEKS) | 12-WEEK LOAD (WEEKS) |
| SHEET METAL | 127 | 24.2 | 18.8 | 6.0 | 9.7 |
| VTL | 82 | 15.6 | 11.6 | 3.3 | 6.2` |
| JIG BORE | 55 | 10.5 | 15.5 | 7.9 | 13.8 |
| TOOL&DIE | 54 | 10.3 | 1.3 | 1.9 | 2.0 |
| MILL | 46 | 8.8 | 12.8 | 11.3 | 17.3 |
| GRIND | 26 | 5.0 | 5.0 | 6.3 | 13.8 |
| EDM | 18 | 3.4 | 1.6 | 3.1 | 5.6 |
| PLASMA | 18 | 3.4 | 7.1 | 21.1 | 32.1 |
| WELD | 18 | 3.4 | 4.0 | 3.3 | 12.8 |
| Figure 1: Rough-Cut Capacity Analysis | |||||
Pareto analysis of shop floor flow patterns, based on the physical moves on all 10,000 work orders closed out in 1988. Figure 2 shows these flow patterns overlaid on a map of the shop floor. Heavier lines indicate more frequent moves between departments.
|
Figure 2: Pareto Analysis of Shop Floor Flow Patterns |
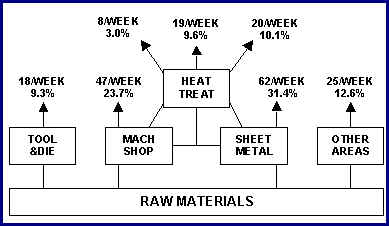
Process flow analysis through the shop routings. Figure 3 shows the mix of the 200 orders per week which flow through each of the major functional shop areas.
|
Figure 3: Process Flow Analysis Through Shop Routings |
The criteria used to identify critical resources were:
DEFINING REPETITIVENESS
Once the critical areas were identified, all open work orders were categorized based on their flow patterns through these critical areas. These generic flow patterns were derived from a detailed analysis of the 4000 open order routings, and the work centers through which each order would flow. Since an order could flow through more than one critical area, a hierarchy was established among the constraints; an order would be classified based on the most critical area through which it flowed. Figure 4 reflects the hierarchy established, based on a ranking of relative constraints and the direction of material flow.
Since the number of critical resources is minimal in even such a complex, functional shop such as DO, all 4,000 open work orders could be grouped into only seven categories: Tool & Die, Milling, Jig Bore, Grinding, Plasma Spray, Sheet Metal, and Miscellaneous. Note that not all of the critical areas in Figure 4 define order categories. Some areas, such as Heat Treat, Outside Processing, and Inspection could at times become short-term downstream bottlenecks, and were defined to help control flow on the shop floor.
RANK |
DESCRIPTION |
1 |
Tool & Die |
2 |
Milling |
3 |
Grinding |
4 |
Jig Bore |
5 |
Plasma Spray |
6 |
Sheet Metal |
7 |
Heat Treat |
8 |
Outside Processing |
9 |
Excess Capacity Areas |
10 |
In-Process Inspection |
11 |
Final Inspection |
| Figure 4: Resource Hierarchy | |
These order categories were the key to providing a definition of repetitiveness sufficient to support a mechanism for pulling work into the shop - based on the consumption of critical resource capacity. That is, work in a category would be released into WIP based on the completion of work in that category.
REDUCING WORK IN PROCESS
After all open orders were categorized, a required throughput level (orders to be completed per week) was established for each category. The orders in each category were grouped into weekly buckets by promised completion date, and the resulting order profiles were smoothed out over the scheduling horizon to provide the average number of orders per week which had to be completed from each category (Figure 5).
Based on these required throughput levels, management set initial target WIP levels of 3 to 8 weeks of orders for each category, calculated as follows. Tool & Die orders, for example, average about 123 man-hours of hands-on time per order, based on historical records. A work/wait ratio of 15% would mean that a Tool & Die order would spend about 820 total hours in the shop (123/.15), or about 10 weeks (820/80 working hours per week). At a throughput level of 11 orders per week (Figure 5), the theoretical target WIP level for Tool & Die orders was about 110 orders. Similar calculations were also made for the other categories. Of course, the minimum total WIP level in DO's case would be about 300 orders, or one for each operator on a shift.
| CATEGORY |
WEEK DUE |
TOTAL |
5-WK AVG |
||||||||||||
PAST DUE |
1 |
2 |
2 |
4 |
5 |
6 |
7 |
8 |
9 |
10 |
11 |
12 |
|||
| TOOL & DIE | 41 |
7 |
9 |
6 |
3 |
3 |
2 |
2 |
|
73 |
13 |
||||
| MILLING | 133 |
16 |
20 |
11 |
6 |
6 |
22 |
1 |
1 |
216 |
37 |
||||
| GRINDING | 140 |
11 |
14 |
5 |
8 |
178 |
36 |
||||||||
| JIG BORE | 115 |
22 |
11 |
7 |
3 |
6 |
6 |
3 |
1 |
174 |
32 |
||||
| PLASMA | 71 |
7 |
3 |
2 |
2 |
3 |
1 |
1 |
|
90 |
17 |
||||
| SHEET METAL | 186 |
77 |
36 |
36 |
18 |
10 |
1 |
6 |
1 |
1 |
6 |
378 |
71 |
||
| MISC. | 113 |
23 |
15 |
7 |
7 |
1 |
1 |
1 |
1 |
169 |
33 |
||||
| TOTAL | 799 |
163 |
108 |
74 |
47 |
29 |
11 |
31 |
6 |
4 |
6 |
1278 |
238 |
||
| Figure 5: Open Orders Due by Week | |||||||||||||||
Work in process was then decreased to the target levels, category by category, through a combination of techniques:
Canceling orders which were no longer required
. A little research revealed that a number of orders had been in the shop for months, or even years, and were no longer required.
Temporarily increasing capacity in bottlenecked work areas
. This was particularly effective in downstream temporary bottlenecks, such as Heat Treat or Final Inspection.
Physically removing lower priority orders from the shop floor.
This "de-releasing" of low-priority orders was particularly important for demonstrating management's commitment to the approach, while improving visibility of actual requirements.
Restricting order release to fewer orders than were completed
. Once the initial cleanup of WIP was accomplished, this enabled management to continue to approach the target levels gradually, without additional disruption to the floor.
It should be noted that the initial target WIP levels for each category were determined theoretically. The actual minimum levels were determined empirically by reducing the WIP in each category until idle time was forced in the critical area. The WIP was then raised just to the level which was required to keep the critical resources fully utilized.
CONTROLLING ORDER FLOW
The final step in the development of the MTO KANBAN system was to provide mechanisms for controlling the flow of orders through the shop and the release of orders to WIP. The key flow control mechanism, and the heart of the MTO KANBAN system is the Open Orders Profile (Figure 6). This report, which is generated weekly, shows the number of orders in each category which are currently backlogged at each critical area, as well as the total WIP for each category relative to its target.
| CATEGORY | UNREL |
TOOL & DIE |
MILL |
GRIND |
JIG BORE |
PLASMA |
SHEET METAL |
HEAT TREAT |
OUTSIDE PROC |
MISC |
INPROC INSP |
FINAL INSP |
TOTAL WIP |
TARGET WIP |
| TOOL & DIE | 14 |
35 |
2 |
5 |
2 |
0 |
2 |
0 |
4 |
21 |
0 |
17 |
88 |
100 |
| MILLING | 171 |
63 |
1 |
19 |
0 |
17 |
3 |
50 |
65 |
18 |
5 |
241 |
240 |
|
| GRINDING | 23 |
14 |
4 |
2 |
5 |
0 |
13 |
15 |
13 |
11 |
77 |
80 |
||
| JIG BORE | 192 |
29 |
1 |
29 |
3 |
26 |
42 |
29 |
8 |
167 |
170 |
|||
| PLASMA | 416 |
77 |
21 |
3 |
40 |
11 |
24 |
1 |
177 |
80 |
||||
| SHEET METAL | 377 |
193 |
7 |
27 |
74 |
50 |
14 |
365 |
225 |
|||||
| MISC. | 150 |
4 |
50 |
89 |
16 |
8 |
167 |
200 |
||||||
| TOTAL | 1343 |
35 |
65 |
20 |
54 |
80 |
267 |
20 |
210 |
317 |
150 |
64 |
1282 |
1095 |
| MANPOWER | 27 | 23 | 13 | 30 | 9 | 75 | 6 | 115 | 10 | 8 | 316 | |||
Figure 6: Open Order Profile |
||||||||||||||
The MTO KANBAN system is administered via a weekly one-hour "strategy meeting" involving personnel from Material Planning, Area Expediting, Shop Supervision, and Shop Scheduling. Using the Open Orders Profile, shop resources are allocated, overtime is scheduled, and orders are off-loaded based on the relative load/capacity relationships among order categories and key work areas. If a temporary bottleneck is developing, it can be quickly identified and resolved. Thus, orders are kept flowing by the timely resolution of such problems as engineering holdups, material shortages, lack of capacity, and lack of operator flexibility. Of course, the number of orders authorized for release each week is merely the difference between the Total WIP and Target WIP in each category on the Open Orders Profile.
Note that what makes a work area a temporary bottleneck is not just that it is overloaded; the key issue is whether or not it is holding up the completion of orders to stock, and thus impeding the release of orders to critical resources. Management is committed to a policy of not releasing work in an order category just to keep people busy - that is, unless an order closes to stock from that category. Completion of work through only the critical work centers does not trigger release, since an order may be delayed at a temporary bottleneck further downstream. If, for any reason, orders must be released in violation of the target WIP levels, the Shop Expeditors "de-release" and physically remove from WIP a corresponding number of the lowest priority orders in that category.
WORK ORDER |
PART NUMBER |
DESCRIPTION |
CATEGORY |
RELEASE DATE |
20030 |
59430 |
DUCT |
GRIND |
10/22 |
28760 |
58680 |
DIFFUSER |
GRIND |
10/23 |
21090 |
58798 |
LINER |
JIG BORE |
10/1 |
21070 |
51843 |
LINER |
JIG BORE |
10/8 |
21080 |
54358 |
LINER |
JIG BORE |
10/12 |
25550 |
59911 |
CASE |
JIG BORE |
10/17 |
21440 |
59076 |
CASE |
JIG BORE |
10/18 |
22050 |
52837 |
CASE |
JIG BORE |
10/18 |
27110 |
59294 |
DIFFUSER |
MILL |
10/15 |
27120 |
53584 |
DIFFUSER |
MILL |
10/15 |
27330 |
52564 |
DIFFUSER |
MILL |
10/16 |
29990 |
58852 |
DIFFUSER |
MILL |
10/18 |
20580 |
53911 |
CLOSURE |
SHEET METAL |
10/7 |
21320 |
56452 |
SEGMENT |
SHEET METAL |
10/9 |
21160 |
55475 |
SEGMENT |
SHEET METAL |
10/13 |
| Figure 7: Unreleased Orders | ||||
Supporting the Open Orders Profile is a listing of unreleased orders, by category, in scheduled release date sequence (Figure 7). As WIP levels drop below target, new orders are released in the sequence listed. If more orders are scheduled for release than are authorized, they are offloaded, or lower priority orders are "de-released". If fewer orders are scheduled for release than are authorized, personnel at critical resources are redeployed to other areas; orders are not released prior to their scheduled release dates unless shop load reports indicate an overload in a future period.
Lists are also generated each week showing, by order category, showing the released orders currently in backlog at each of the major work areas (Figure 8). These lists are used, along with the scheduling dispatch lists, to make off-loading, overtime, and "de-release" decisions.
WORK ORDER |
PART NUMBER |
DESCRIPTION |
CURRENT LOCATION |
DUE DATE |
TOTAL BY LOC |
21160 |
56122 |
SEGMENT |
MILLING |
10/13/89 |
|
25550 |
57114 |
CASE |
MILLING |
10/17/89 |
2 |
21070 |
53620 |
LINER |
GRIND |
10/8/89 |
|
21320 |
50575 |
SEGMENT |
GRIND |
10/9/89 |
|
21080 |
57259 |
LINER |
GRIND |
10/12/89 |
|
27330 |
55206 |
DIFFUSER |
GRIND |
10/16/89 |
|
26500 |
56967 |
CASE |
GRIND |
12/23/89 |
5 |
27110 |
53315 |
DIFFUSER |
JIG BORE |
10/15/89 |
|
22050 |
53914 |
CASE |
JIG BORE |
10/18/89 |
2 |
20580 |
58262 |
CLOSURE |
SHEET METAL |
10/7/89 |
|
27120 |
56684 |
DIFFUSER |
SHEET METAL |
10/15/89 |
2 |
| Figure 8: Open Tool & Die Orders by Location | |||||
CONCLUSION
The MTO KANBAN system supplements, rather than replaces, the existing shop scheduling system. As the number of orders on the floor is reduced, new orders can be released much closer to actual requirements. Since orders are released only if they are needed, and only if they can be worked to completion, the priorities set by the scheduling system for individual work centers are now seldom overridden. In addition, existing shop load reports are now better able to provide visibility for controlling backlogs at individual work centers.
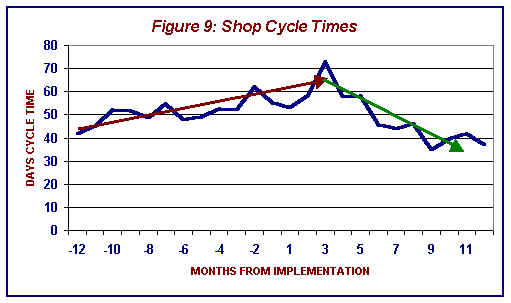
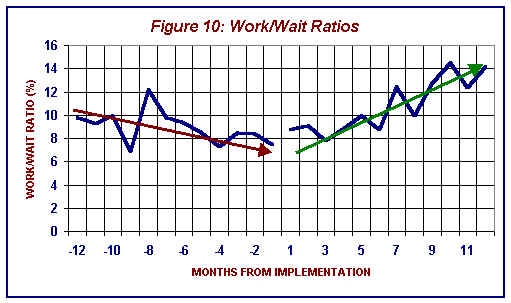
Because the approach was vigorously supported by upper level management through changes in policy, and because the users were involved in its design and implementation, the result has been a significant improvement in control over work in process. Within a year, shop cycle times were down from 11 weeks to about 7 weeks (and eventually to 5 weeks), a 45% reduction (Figure 9). That is, the number of open orders in the shop was down to about 1000, and critical resources were still being fully utilized. At the same time, the overall work/wait ratio in the shop increased to over 15% (Figure 10), and the number of orders overridden with special priority codes dropped from 40% of all open orders to less than 2%. Finally, because shop labor was going into throughput rather than inventory, the shop was completing over 200 orders per week, with about 10% more labor content per order. Plant management considered the MTO KANBAN system an unqualified success.
Of course, the MTO KANBAN approach has also been successfully implemented in a number of shops which are far less complicated than Development Operations, and with similar results. MTO KANBAN is being used for the control of low-volume "specials" in conjunction with repetitive Kanbans for high-volume work. It is also applied to finish-to-order products, where the demand for common component parts is repetitive enough for the conventional Kanban approach. In any event, it is clear that every manufacturing business, whether repetitive or make-to-order, or anywhere in-between, can now benefit from the control of work flow through the application of the pull signals methodology.
![]()